|
ECR Browser :: Instructions http://ecrbrowser.dcode.org |
| Introduction |
|
The ECR Browser is a dynamic graphical interface that allows users to visualize and analyze Evolutionary Conserved Regions (ECRs) in genomes of sequenced species. Since its initial implementation, when only the genomes of human and mouse were available, the ECR browser has been constantly expanding to include newly sequenced genomes, and now covers 13 species (see below). By aligning the sequence of one genome (any of the available genomes can be chosen as the "base") with others in a pairwise fashion, a conservation profile is created, which can be graphically displayed for any locus in the "base" genome. ECRs are identified as regions of high sequence identity against a neutrally evolving background. By scanning the pairwise alignments, the browser detects sequence elements of significant length that are conserved above a certain level of sequence identity between the two genomes (specified in the user-defined parameters) and highlights them as ECRs. ECRs are represented as colored peaks on a graph, with the x-axis representing positions in the base genome and the y-axis representing % identity between the base and aligned genomes at that specified position. Below is an example of the ECR Browser visualization of the human/mouse conservation profile of the human SRPRB gene.  |
| A quick guide to ECR Browser graphical features |
|
The new implementation of the ECR browser was designed to provide a more intuitive interface for visualizing various features of the genomes explored, while offering a consistent experience to long-time ECR browser users. The display is centered around a smooth conservation plot in which the sequence of the base genome is represented on the horizontal axis. The height of the conservation plot at each position represents the number of nucleotides conserved in a windows of 100 nucleotides centered on that position, and is based on the blastz derived pip-plot (see below). The length of the horizontal alignment line correpsponds to the alignment length in the base sequence, while its vertical position corresponds to the level of nucleotide identity in this alignment. A vertical axis cut-off of 50% to 100% identity is utilized to visualize only the significant alignments. ECRs that meet predefined length and identity criteria (default values are set to 100 nucleotides and 70%, but are user-customizable), can be easily identified by the pink rectangles at the top of the plot. To demarcate ECRs in relation to protein coding features, annotated genes are depicted as a horizontal blue line above the graph, with strand/transcriptional orientation indicated by arrows. Blue boxes along the line correspond to positions of coding exons, while yellow boxes correspond to UTRs. Peaks within the conservation profile that correspond to these exons are similarly colored within the plot. Peaks within the conservation profile that do not correspond to transcribed sequences are highlighted in red if they are intergenic or salmon if they lie within an intron. Regions colored in green correspond to transposable elements and simple repeats.  |
| How to start using ECR Browser |
The fastest way to start navigating the ECR Browser is to type in the gene name (e.g. GATA3) into the location field. Otherwise you can indicate an absolute chromosomal location using this form in this format (to describe chromosome 17 between locations 1000-2000 bp): chr17:1000-2000.  The location form also contains additional information on the base genome that is being used currently (in this example it is the hg18 freeze of the human genome in the notation adopted at UCSC Genome Browser), the length of the genomic locus being visualized (20,496 bps in this case), as well as the parameters used for graphical rendering of the genomic information. If you type in a partial gene name all genes named similarly to that search pattern will be retrieved and listed, with full names and locations of these genes in the base genome linked directly to their visualization profiles in the ECR Browser. For example, if you type in 'GATA' into the location form while using the human genome as a base genome and click on the 'Submit' button, you will be provided with a choice of loci that contain the term "GATA" in their name or definition. Just click on your choice to return to the main browser window. 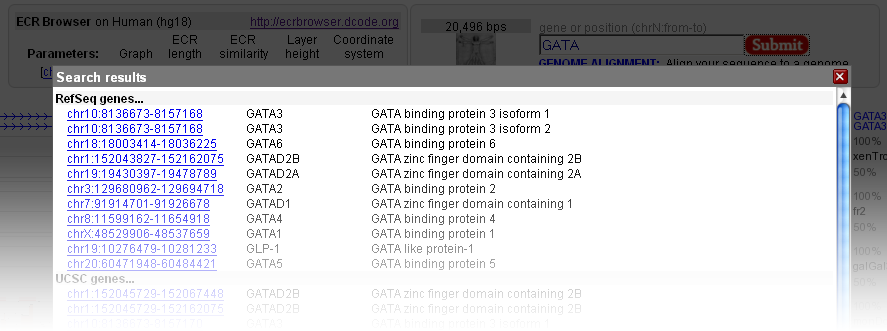 |
| Browser settings |
The ECR Browser provides the flexibility to dynamically change the parameters utilized to generate conservation profiles. There are five main parameters, illustrated in the following figure, that the ECR Browser uses to create the graph. Users can choose between pip-plot and smooth graph types (find below what the difference between the two types is), as well as the height of the layers which contain these graphs (this represents the height in pixels that the conservation graph for each species will have). Users can also set the minimum length and identity of ECRs (set by default to 100 bps and 70%) to be displayed as pink rectangles on top of the graph, as well as whether the sequence coordinates dispalyed are absolute genomic coordinates or are relative to the current window. 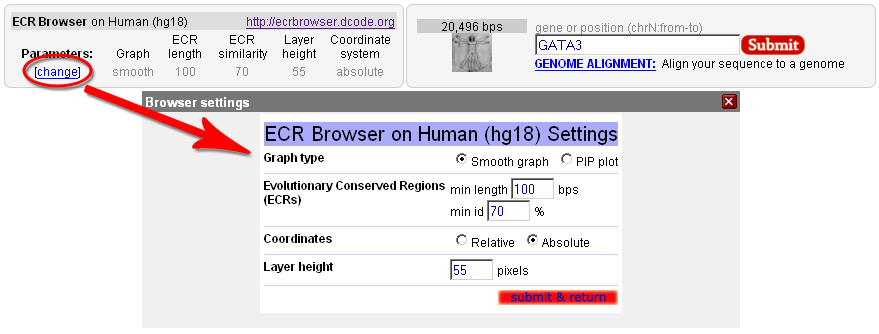 Note that the Core ECRs button in the top menu is a shortcut for automatically setting the ECR length to 350 nucleotides and the ECR similarity to 77%. Click on the [?] next to it, or here, to learn more about core ECRs.  The ECR Browser also provides an easy and intuitive way of adding and removing species to/from the comparisons being visualized. Different annotation tracks can be added/removed in the same way as illustrated below: 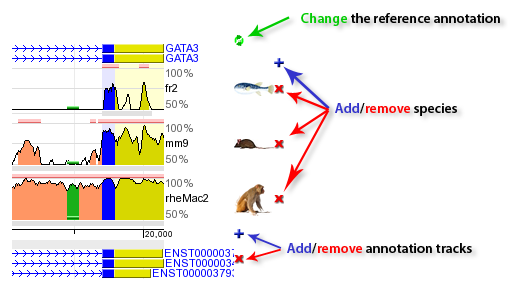 Note that when the reference track is changed, the coloring of the genomic features will reflect the new annotation information, e.g. if additional exons are present in the new annotation track, the corresponding regions will turn blue. As an added convenience, the additional tracks below the graphs can be overlayed onto the conservation plots. This feature can be particularly useful in situations where you want to see if, for instance, predicted exons overlap with ECRs, like in the following example. And if you drop this track onto the conservation plots, this annotation will conveniently become the reference annotation.  |
| Navigating through genomes |
The ECR browser offers several easy ways for navigating thorugh the genomic landscape. As presented above, the location field can take you straight to a gene or genomic coordinates of potential interest. Besides this, the new version of the ECR browser implements a few more intuitive navigation posibilities. For example, the figure below illustrates how one can simple drag the browser window to either left or right after clicking somewhere in the graph area. Center marks for the graph and the window being moved should help in repositioning the graph in the view field. While dragging the content, colors of the graph fade, and will become to normal once the graphical information for the new window is calculated.  The Left and Right buttons at the bottom of the graph can also be used for moving the viewing window to the... left and to the right, obviously, with 25% of the current window length (e.g. if the current window displays 1000 nucleotides, pressing the Left button will shift the view 250 nucleotides to the left). The same effect can be obtained with the < and > keys. Zooming in and out is also easily done through the six buttons that can be also found at the bottom of the graph, which can provide 1.5x, 3x, and 10x zoom in or zoom out steps. If your mouse has a scroll wheel, you'll be surprised to learn that it will function in the same way as it does for Google maps. It's zooming power is set to 3x. |
| Custom annotation |
|
One of the new features of the ECR Browser is the ability to display graphically various features submitted by users. The format of the data is fairly simple, and details are presented in the submission page. To illustrate the power of the ECR Browser to represent user data, you can find bellow the image produced using this code: |
|
default_genome="hg18" default_location="chr5:1935001-1940000" description="GATA ChIP-seq binding specificities" chr5:1938001-1938050 name="GATA2" color="255,0,0" chr5 1938100 1938120 name="GATA3" color="0,0,255" shape="ellipse" chr5 1938120-1938150 name="GATA3" color="0,0,255" shape="ellipse" chr5:1935500-1937500 name="Gene A" exons="1935500-1936500,1937000-1937500" color="230,150,0" cds="1935590-1937100" strand="-" chr5:1937501-1937900 name="promoter" color="0,150,0" chr5 1938500 y:0.0 color="200,0,200" chr5 1938520 y:0.1 chr5 1938540 y:0.2 chr5 1938560 y:0.4 chr5 1938580 y:0.99 color="255,0,0" chr5 1938600 y:0.5 chr5 1938650 y:0.21 chr5 1938700 y:0.5 chr5 1938800 y:0.21 chr5 1938820 y:0.4 color="0,200,200" chr5 1938860 y:0.8 chr5 1938899 y:1.0 description="Computational binding site predictions" chr5:1937001-1937050 name="GATA" color="255,0,255" chr5:1937501-1937550 name="GATA" color="255,0,255" chr5:1938001-1938050 name="GATA" color="255,0,255" chr5:1938501-1938550 name="GATA" color="255,0,255" |
|
The result? Like in the following picture:  Enjoy creating your own ECR Browser art! |
| Genome alignment |
The 'Genome alignment' feature of the ECR Browser is designed to provide the user with a capability to map a user-submitted sequence to one of the 'base' genomes and to align the submitted sequence with the homologous region from the chosen genome. The input sequence could be submitted as a FASTA file or can be automatically downloaded from the GenBank by a known accession number, like in the following example. 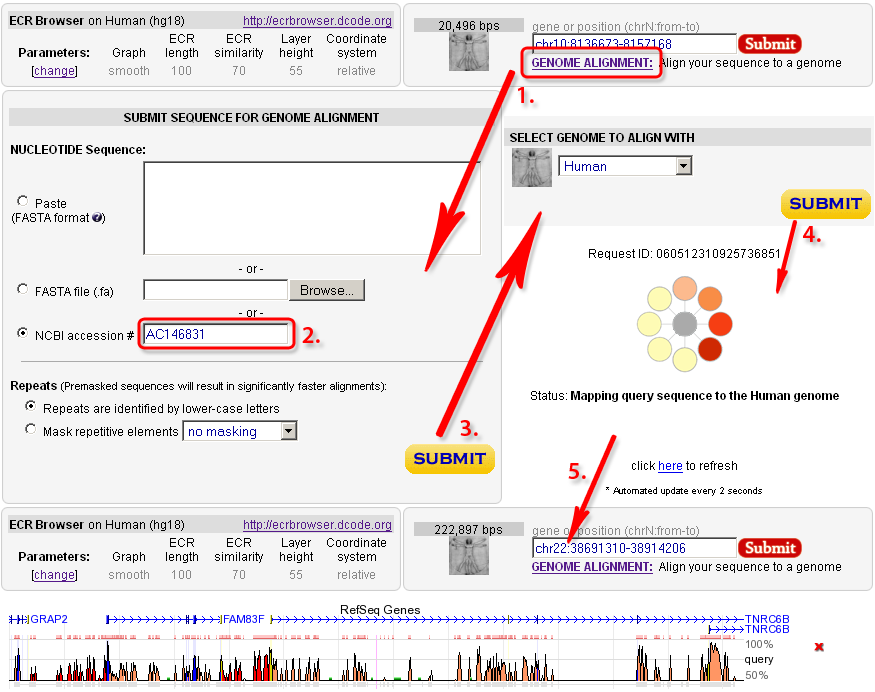 |
| Sequence features that correspond to ECRs |
|
Coding exons. A large fraction of the ECRs identified in any genome alignment correspond to conserved protein coding exons (blue bar in the conservation plot). Due to the functional significance of protein-coding sequences, coding exons are generally under strong selection pressure to stay unchanged. Therefore, while the neutral background diverges and 'disappears' from the conservation plot as the evolutionary distance between two genomes is increased, coding exons often remain as prominent conserved-sequence peaks. It is usual to observe a single, unbroken horizontal alignment line corresponding to coding exons since insertions and deletions (gaps in the alignment) that will change the translation frame are usually not tolerated. Novel genes. Despite recent advances in annotation of the human genome, there are still many genes that remain unknown. The ECR Browser provides graphical annotation of gene predictions above the track of ECRs so that conservation levels of predicted exons can be scrutinized. Since most coding exons are conserved in vertebrate alignments, the ECR browser therefore represents a tool for finding and evaluating novel genes and unannotated alternative exons. In some cases the conservation profile mimics either partially or completely a gene prediction transcript and provides additional evidence that the predicted gene is a real, functional gene. In the example below, exons predicted by Genscan in a region with no known-genes, correspond very well to a cluster of ECRs within the region, providing evidence that this prediction could potentially correspond to a functional gene. Additional ECRs conserved inbetween Genscan exons could represent candidate exons for an alternatively spliced transcript, or potentially, to regulatory elements within the gene.  Promoters and enhancers. For some genes, transcription is driven partly or even primarily by enhancer elements located immediately upstream of the promoter. These elements, if they have remained conserved in two compared species, can be easily identified as 'red peaks' located near and upstream of the 5' end of the gene. In the example below, the IL4 gene promoter / proximal enhancer region is visualized.  Distant regulatory elements. Additional function is hidden in elements that lie far away from genes and regulate the spatial and temporal transcription patterns of neighboring genes. Regulatory ECRs are often conserved throughout evolution, and excellent candidates for such distant regulatory elements can be identified in ECR Browser as well conserved elements located between the annotated genes. The example plot above displays an experimentally verified regulatory element of IL4 cytokine (Loots GG et al., Science. 2000 Apr 7;288(5463):136-40) that is located ~10kb upstream of the transcription start site of IL4. It is worth mentioning that this distant regulatory element also drives expression of a second cytokine gene, called IL5, that is located ~120kb away. Active regulatory elements can in fact be located hundreds of kb away from the genes that they control, especially in regions of low gene density (see below). |
| Comparing distant vertebrates |
In the examples above, ECRs were identified as conserved peaks in the conservation graph of human vs. mouse, and dog DNA. Indeed, human/mouse comparative sequence alignment has provided an invaluable tool for functional-element annotation in both genomes. However, because different regions of vertebrate genomes appear to be diverging at very different evolutionary rates, no single type of two-way comparison can be applied with guaranteed success to all genomic loci. In certain regions, human-mouse conservation is too high overall for alignments to usefully single-out specific conserved elements for further study. For example, in a recent study of human gene deserts, Nobrega M, Ovcharenko I, et al. (Science 2003 Oct 17;302(5644):413) found that in such regions, human/mouse comparative alignments often yeild thousands of non-coding ECRs per gene. These authors discovered that distant evolutionary comparisons, in this case between human and pufferfish, provided a highly efficient way to sift through this multitude of ECRs to find those with highest probability of function. Nine human/fish identified ECRs were shown to be functional enhancers of the DACH locus, with the potential to recapitulate the complex developmental expression pattern of the gene. The most distant enhancer was found as far away as 1 megabase from the transcriptional start point of DACH. In other regions, human-fish comparisons may yield no conserved elements at all, even near genes with deeply conserved function. As these examples illustrate, there is no ideal pairwise comparison or single set of rules regarding evolutionary distance between aligned genomes that will permit all functional elements to be identified in a region of interest. For that reason, ECR browser provides access to multiple pairwise genomic comparisons so the user can choose the most suitable combination for analysis of each particular locus. |
| Genomes compared |
The current version of the ECR Browser (06/01/2008) contains pairwise alignments for the genomes of 13 species: human (Homo sapiens), chimpanzee (Pan troglodytes), rhesus monkey (Macaca mulatta), mouse (Mus musculus), rat (Rattus norvegicus), dog (Canis familiaris), cow (Bos taurus), opossum (Monodelphis domestica), chicken (Gallus gallus), frog (Xenopus laevis), zebrafish (Danio rerio), fugu pufferfish (Takifugu rubripes), and spotted green pufferfish (Tetraodon nigrovoridis). The table below present the available pairwise genome comparisons that can be explored with the ECR browser. Any of the 13 available genomes can be selected as the "base", but the list of genomes available for comparison is still incomplete for some of them. The alignments are currently being computed, and all comparisons should be available in the near future. 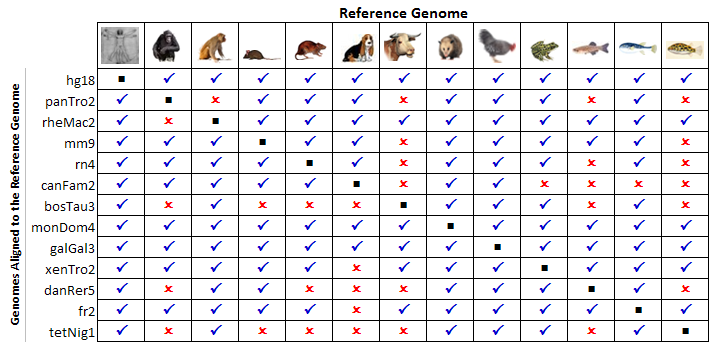 |
| Selecting the base genome |
The ECR browser displays all genomic features are in reference to a "base" genome, so one "base" needs to be selected. This can be chosen either from the ECR Browser front page, or at any time after that by pressing the left-most button in the top menu bar from the ECR main page, as showed below: 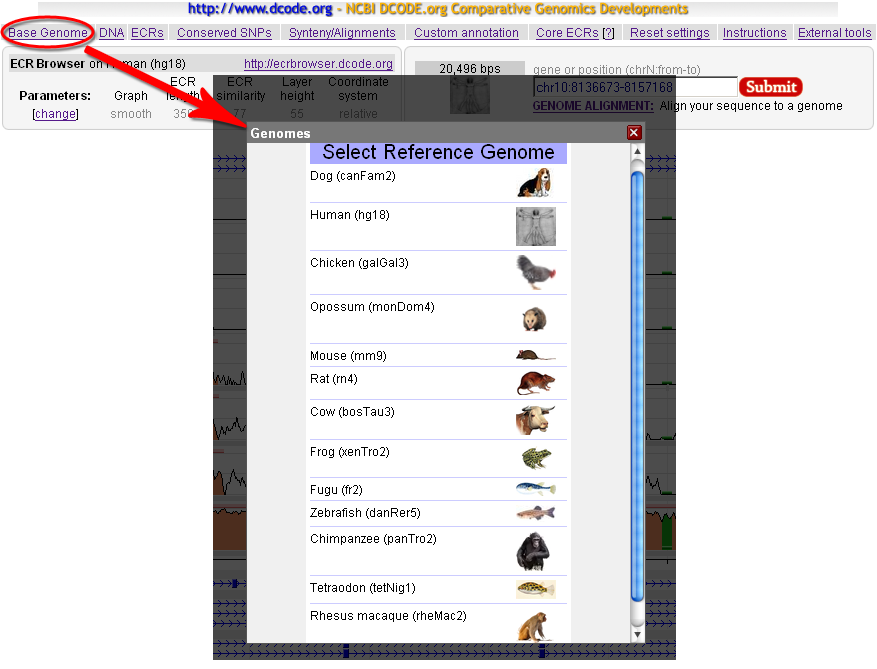 Any of the 13 available genomes can be selected as base, but for some of them the choice of compared genomes is limited (see above). When the base genome is switched, all chomosome coordinates displayed by the browser will correspond to the selected base genome; the list of available chromosomes will be limited by the sequenced structure of the genome and the graphical display of genes and other features will correspond to annotation in that genome. User can flip back and forth between different base genomes to view structure and gene content, annotation and other features attributed to each species. |
| Looking closer at ECRs |
The absolute genome positions for all the ECRs detected in the visualized locus can be obtained through the ECRs link from the top menu of the ECR Browser. The ECRs are listed sequentially, and the coloring follows the scheme presented above. Both relative (to the visualized window) and absolute coordinates are provided. In the example below, a list of human-mouse ECRs from the GATA3 locus is presented. As indicated by the colors, most of them are found in intronic regions, but a few of them also contain exonic sequences (shown in blue). 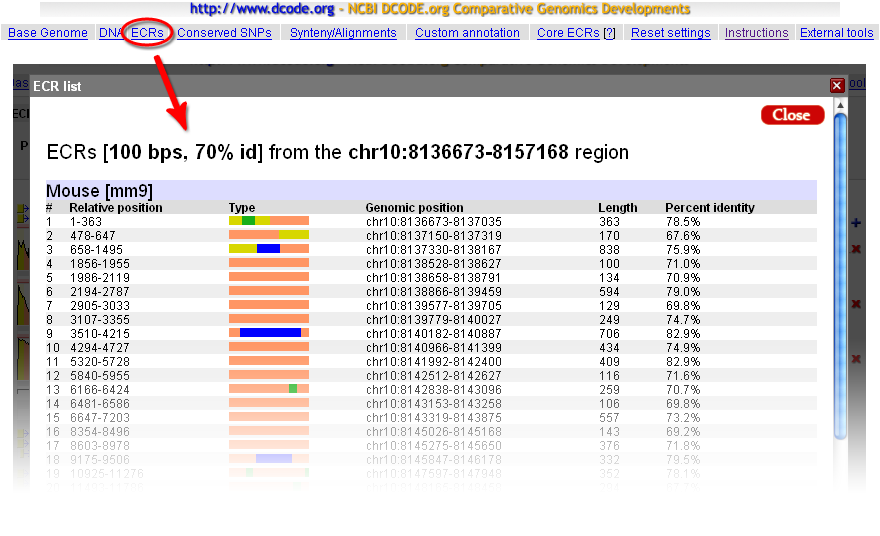 Access to the alignment and/or the sequence of the ECRs is provided directly from the main window. Hovering the mouse cursor over any ECR will provide basic information about that ECR, and a click on a given ECR will open a window where both the alignment and the sequences from the two species are provided, as illustrated in the figure below: 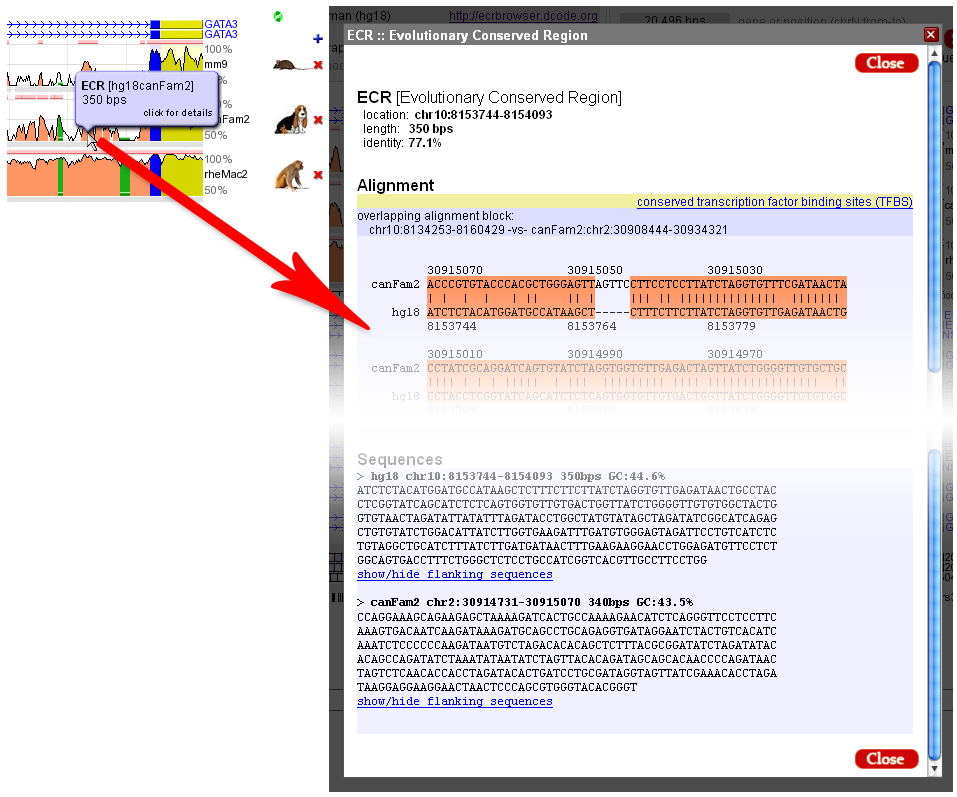 |
| Underlying DNA sequence |
The 'DNA' link of the top bar of the ECR Browser provides with an access to the genomic sequence of the base genome that underlies the conservation plot. The sequence obtained by following this link will be in upper case except for the regions that correspond to repetitive elements. These repeat regions are in the lower-case letters.  |
| Synteny links, alignments, dot-plots and annotation of conserved transcription factor binding sites |
Synteny relationships underlying ECR Browser conservation plots can be displayed using the 'Synteny/Alignments' link in the top menu. In the example below, the 20kb locus of the human GATA3 gene on chr10 is analyzed for matches to mouse, dog, and rhesus monkey genomes. Every homologous region from a matching genome contains a 'blue-gray' homology profile, where the blue color corresponds to regions of conserved synteny. We observe that homologous loci are identified in each of these genomes, but small segments also have matches in other regions of the target genomes. Coordinates in the two genomes are provided, with direct links to those regions. If the link to the target genome is followed, that will cause the 'base' genome to change, so that it is possible to view the homologus locus of GATA3 gene, for example, in the dog genome, even if there is no gene annotated there. The 'Length' column displays the size of the homologous region and can be effectively used to detect expansion/shrinkage of specific regions in different evolutionary lineages. 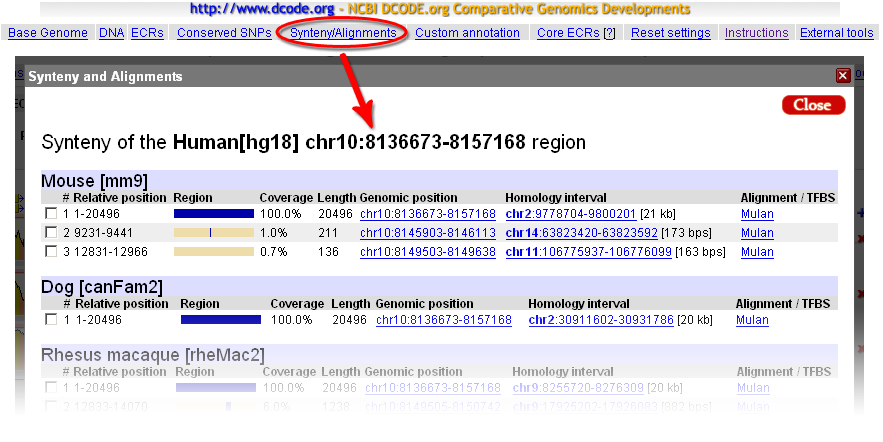 The 'Alignments/TFBS' link will forward a homologous alignment to the Mulan tool (http://mulan.dcode.org/), which provides access to several additional options to manipulate the sequence and to visualize alignments, such as creating a similarity dot-plot, which is a powerfull tool for visually detecting insertions, deletions, reshufflings and inversion events. Mulan also allows the possibility to forward the alignment to the rVista tool (http://rvista.dcode.org/), which is designed to identify and annotate evolutionarily conserved transcription factor binding sites in the alignments. rVista will exclude up to 95% false positive transcription factor binding sites (TFBS) predictions while maintaining high sensitivity of the search. |
| Dynamic links to the UCSC Browser and other tools |
A convenient link to the UCSC Browser is provided under the External tools link at the far right of the top ECR Browser menu. This allows dynamic access to detailed annotation of the genomic locus that is provided by the UCSC Genome Browser. The Base genome selection, its freeze and an exact location data together with the annotation of ECRs in the current display will be forwarded to the UCSC Genome Browser to display exactly the same region as that being viewed in the ECR Browser. Using this function it is possible to study additional functional annotation layers for any locus that are available in the UCSC Genome Browser, and currently not included in the ECR Browser, such as ESTs. |
| Pip-plot vs Smooth-graph |
Any ECR Browser profile can be visualized as either a Pip-plot or Smooth-graph. The main difference between these two types of visualization in the method of constructing the black conservation graph. In the case of a Pip-plot every ungapped aligment is visualized as a separate horizontal line. The length of the line corresponds to the length of the alignment, while its height corresponds to the percent identity of the alignment. Smooth-graphs are constructed by using a sliding window of 100bps through the alignment. Such a window centered at every nucleotide in the base sequence is used to calculate the number of matches inside of this window. This number provides with a percent identity in a sliding window centered at a given position. Percent identity counts in a sliding window are utilized to calculate the height of the smooth conservation graph at each point. Basically, smooth-graph is a smooth average of the Pip-plot. Smooth-graphs present a simplified and clearer view in the conservation profile but loses information regarding gap distribution in the alignment.  |
| Changing the ECR Browser image width |
It is very easy to change the ECR Browser image width. Just resize your browser window and the ECR Browser will mimic the change in the browser window width by changing the width of the browser image to cover all the space in the browser window. |
| Questions or comments? |
dcode@ncbi.nlm.nih.gov. |